Three Palm Software announces WorkstationOne 1.9.1
Carmel, CA, 21 July 2022
The 1.9.1 release of WorkstationOne is now available for customer installs. Short descriptions of the changes in this release are included in the release notes which are available to all customers, with a longer description of the new mechanisms contained in the July 2022 customer newsletter. The major enhancements in this release are highlighted below.
Tomosynthesis Navigation Icon in DirectX3D
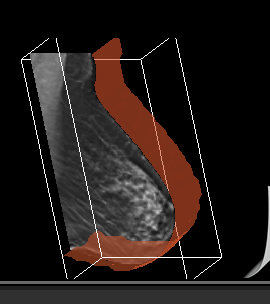
WorkstationOne has for many years supported the display of breast tomosynthesis images as part of the workflow. Within a viewport containing a tomosynthesis image, various mechanisms specific to tomosynthesis are provided. One of these is a 3D graphical icon (showing the real data for the stack contained in this viewport). The existing icon looks like:
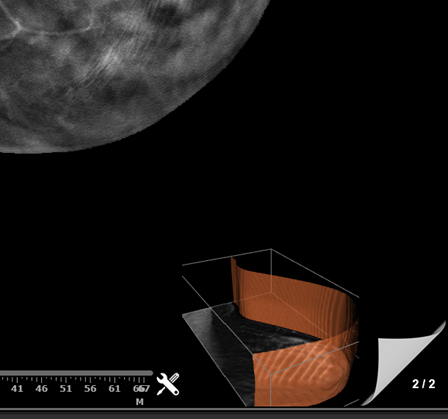
Which shows the detected skin surface, and the current plane as a cut through the breast. The rendering is orientated at an angle that allows visualization of the 3D relationships. This, combined with the position information on the slider, help the user understand the 3D represented by the tomosynthesis images.
The existing implementation of the 3D icon is based on “vtk”, which is a toolkit that internally utilizes opengl for rendering. Unfortunately, Microsoft has stopped supporting opengl, but provides equivalent functionality via the “DirectX 3D” (or Direct3D) toolkit. Newer graphic cards are optimized for Direct3D, and some do not support opengl (there were always some drivers/cards that did not support it well). The result is that an implementation using Direct3D is required for ongoing support, with the added advantages that performance should be better, and additional functionality can be provided to the user.
Direct3D version of icon
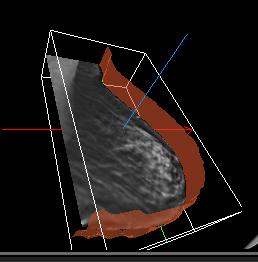
When the Direct3D version of the icon is configured, by default it operates like the previous version of the icon. Thus, the default rendition looks like:
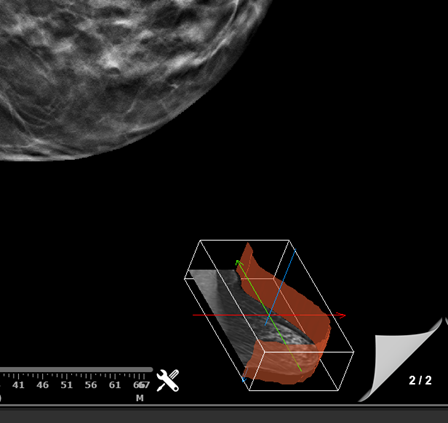
Which is very similar to the previous version – with the exception that the major axes of the volume are drawn. Just like the original version, mouse scrolling causes the stack to scroll (provided it is configured that way by the user – see “mouse wheel” in the user settings). A new feature however is that the Direct3D version responds to a right-click to display a menu for that context:
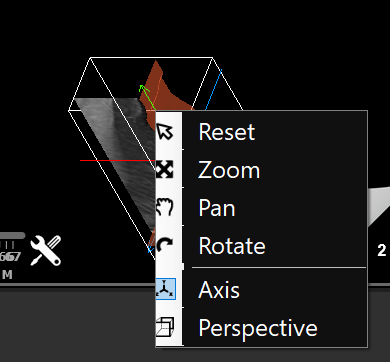
Where:
- Reset – puts the 3D back to the default, undoing any zoom, pan or rotate that the user has performed.
- Zoom – when in this mode, the mouse cursor within the icon region becomes the “zoom” graphic, and then left-clicking and dragging within the icon region results in it zooming (still constrained to the area).
- Pan – when in this mode, the mouse cursor within the icon region becomes the “pan” graphic, and then left-clicking and dragging within the icon region results in the rendering being panned (up/down, left/right) within the icon area.
- Rotate – when in this mode, the mouse cursor within the icon region becomes a “rotate” graphic, and then left clicking and moving left-right or up-down, results in the 3D rendering rotating correspondingly.
- Axis – this is a toggle option – when “on” the axes are displayed.
- Perspective – this also is a toggle option – when “on” the rendering is performed with perspective.
The following pictures show some of these effects. During a rotate with mouse the icon appears like:
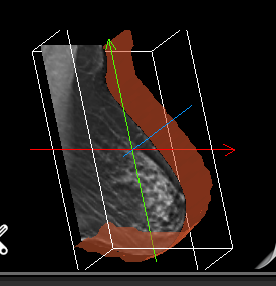
Turning the ”Axis” option off, the image is the same, but without the 3 colored major axes being shown:
When perspective turned on (the default is “off”), the image looks like:
Summary
More information on the use of the tomosynthesis navigation icon can be found in section 5.4 (Viewing breast tomosynthesis images) of the user manual. Configuration information is documented in the service manual section 8.1.4.5 (Tomo NAV).
Screen partitioning
Prior to the 1.9.0 release, WorkstationOne included the ability to have multiple plugins (e.g., viewers for other modalities such as ultrasound) on the same screen(s) as the mammography images – using a tab model. This allows any modality to be on that screen, with manual switching between modalities. This is in addition to the standard mechanism where the plugins are shown on the “navigation” screen.
With large (particularly color) monitors becoming more common, there is an increasing desire to be able to view multiple modalities on the same screen at the same time. This can be achieved by “partitioning” the screen – dividing a large screen into separate (but resizable) areas, one for the mammography images, and the other for other modalities (selected plugins) for that patient.
Partitioning examples
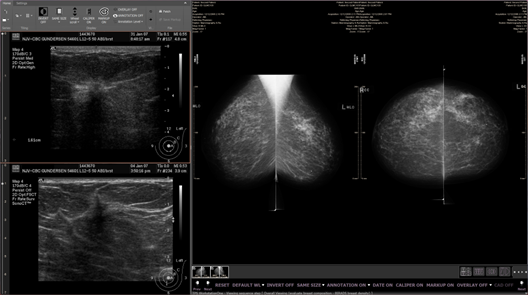
The following screen capture shows a large screen which has been vertically partitioned into an upper area for one plugin (in this case the “Compare” viewer, and the lower for the mammography images:
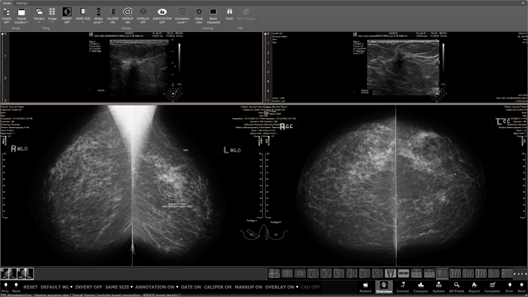
The two areas are separated by a “splitter” bar – the horizontal grey line across the screen. Moving the mouse over that and click and dragging, allows the user to manually set the relative sizes of the regions. For example, moving the splitter all the way to the top of the screen means that the full screen is used for the mammography images:
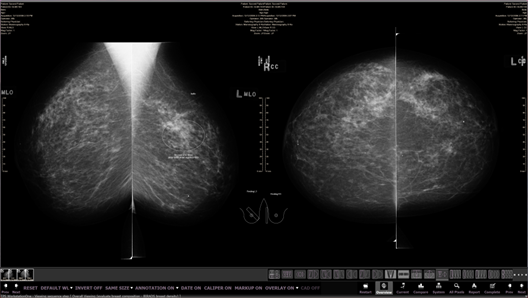
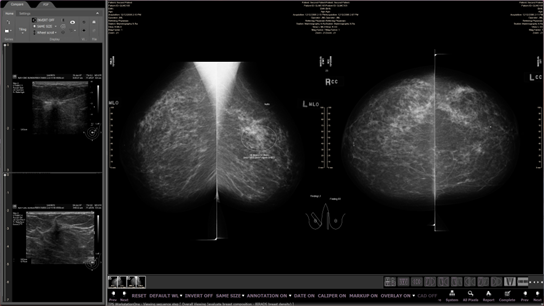
The partitioning mechanism also supports splitting horizontally, for example with the plugin (again the Compare viewer) shown on the left side of the screen, and the mammography images to the right:
The assignments can be left or right, and top and bottom for vertical partitioning. Additionally, more than one plugin can be assigned to the partition, in which case the user can select between the active plugins using a tab model within that area (which is still resizable):
Summary
The new screen partitioning mechanism should be useful to users with large (e.g., 10 or 12MP) color monitors, where it is desirable to be able to see related modalities simultaneously on the same screen as the mammograms.
CAD, AI and decision support
WorkstationOne has long supported the display of CAD reports – based on the DICOM standard, which is a “structured report” using the “Mammography CAD” templates. See the March 2021 customer newsletter (which accompanied the 1.9.0 release) for more background on the existing CAD and AI support. With the 1.9.1 release there are only minor updates to this – based on new information that is provided by the different vendors. A summary of those changes is included in the release notes.
Worklist score
One of the columns available on the “Advanced worklist” (section 4.2 of the user manual) within WorkstationOne is conventionally labelled “Score” – but it can be called anything (e.g., for a site using ScreenPoint Transpara, that column could be called “Transpara”). The information shown in that column is extracted from the information accompanying the current study and formatted according to the preferences of that vendor.
With their 1.7.1 release, ScreenPoint included more information in their reports. Previously at the case level there was a 1-10 score, but with this change that has been augmented with two additional metrics: 1) a 1-100 exam score that corresponds to the highest region score found in the study; 2) a three-level category label (default being “E”, “I” or “L”, but may be different depending on the configuration of ScreenPoint).
The implication of this is that there are 3 potential metrics that could be used at the case level for sorting and categorizing cases. The 1.9.1 release handles this by allowing any combination of those 3 values to be shown on the worklist (in the “Score” or “Transpara” column). The format (controlling which values to display there) is a service option (see section 7.1.10 of the service manual). Each vendor has a different default format, which can be changed using the service tool (be-config).
In the 1.9.1 release, the default for ScreenPoint Transpara (1.7.1 and later) is to show the three metrics:
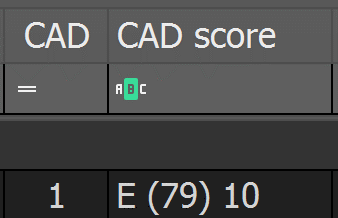
Which shows the score for one case as “E (79) 10” which is “E” (for “elevated” with a 1-100 highest region score of 79, and a corresponding Transpara 1-10 score (here “10”). Older SR (from 1.7.0 etc) just show the original 1-10 Transpara score.
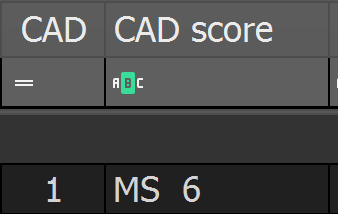
A newly supported vendor is Therapixel – which has a default score like:
CAD corner information
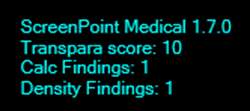
For ScreenPoint Transpara prior to 1.7.1 the default corner information was shown like:
With the 1.9.1 release of WorkstationOne, and a Transpara report for the 1.7.1 version, the displayed information becomes:
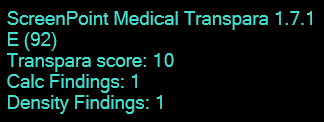
The new line (here “E (92)”) only appears for 1.7.1 reports – older reports do not show the additional line of information.
There have similarly been updates to the format for other vendors. For example, for CureMetrix the new format is:

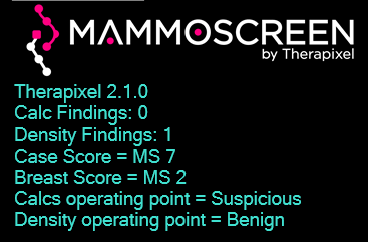
For the newly supported Therapixel, the corner information looks like:
Summary
While the new CAD and AI features in this release do not appear large, the message is that WorkstationOne continues to evolve to utilize new technology and to handle changes in the data sources.